


Instagram posts can showcase the city highlights, uncover the aspirations of residents, and illustrate a variety of their activities in public spaces. While we should not expect it to deliver an accurate picture of reality, Instagram can still be a valuable source of data for city research. See how we explored Bratislava parks using Python and Instagram API1.
The most instagrammable posts published from Bratislava parks in 20202.
Scrolling through feeds and exploring hashtags can be endless fun for city researchers (hover or click on the dots above to see the pictures). But how to speed it up by automating the extraction of thousands of posts for further data mining? For this purpose, we developed a Python package3 that facilitates the process of:
- scraping posts from Instagram API
- preprocessing and cleaning
- analysis and visualisation
You may be wondering what a post obtained from Instagram looks like. What information does it contain?4 How could it be useful to city researchers?

The Python package made it possible for us to parse tens of thousands of raw Instagram posts into a database and download the corresponding images.
Intent on ensuring our tool was fit for purpose, we selected five public parks in Bratislava with different popularity levels and distinctive characters on Instagram. Once we scraped all available posts5, we managed to discover their detailed content and subjects. We addressed this challenge in several ways, for most of which the hashtags played a key role.
Start exploring the parks by clicking on links, or keep reading about how we crunched the data.
Topic discovery and basic exploration
1. Popular hashtags
Finding the most popular hashtags is an obvious approach that can produce intriguing outcomes, especially when tags are grouped into time intervals. This way, we monitored how the frequency of selected topics evolved over the years or varied between weekdays.
2. Predefined categories
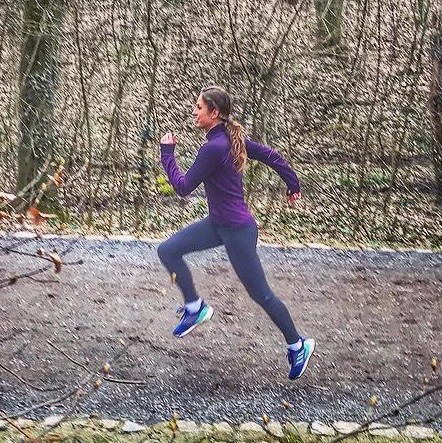
We then took it a step further by assigning hashtags to our nine self-defined categories. For example, if a post was published with at least one of the tags such as #running, #bike, #hiking, we allocated it to the broader category of “outdoor activities”.
3. Topic modelling
Instead of imposing top-down categories, we also took a completely different approach whereby we delegated the hashtag analysis to unsupervised machine learning algorithms that identified the most important topic clusters.
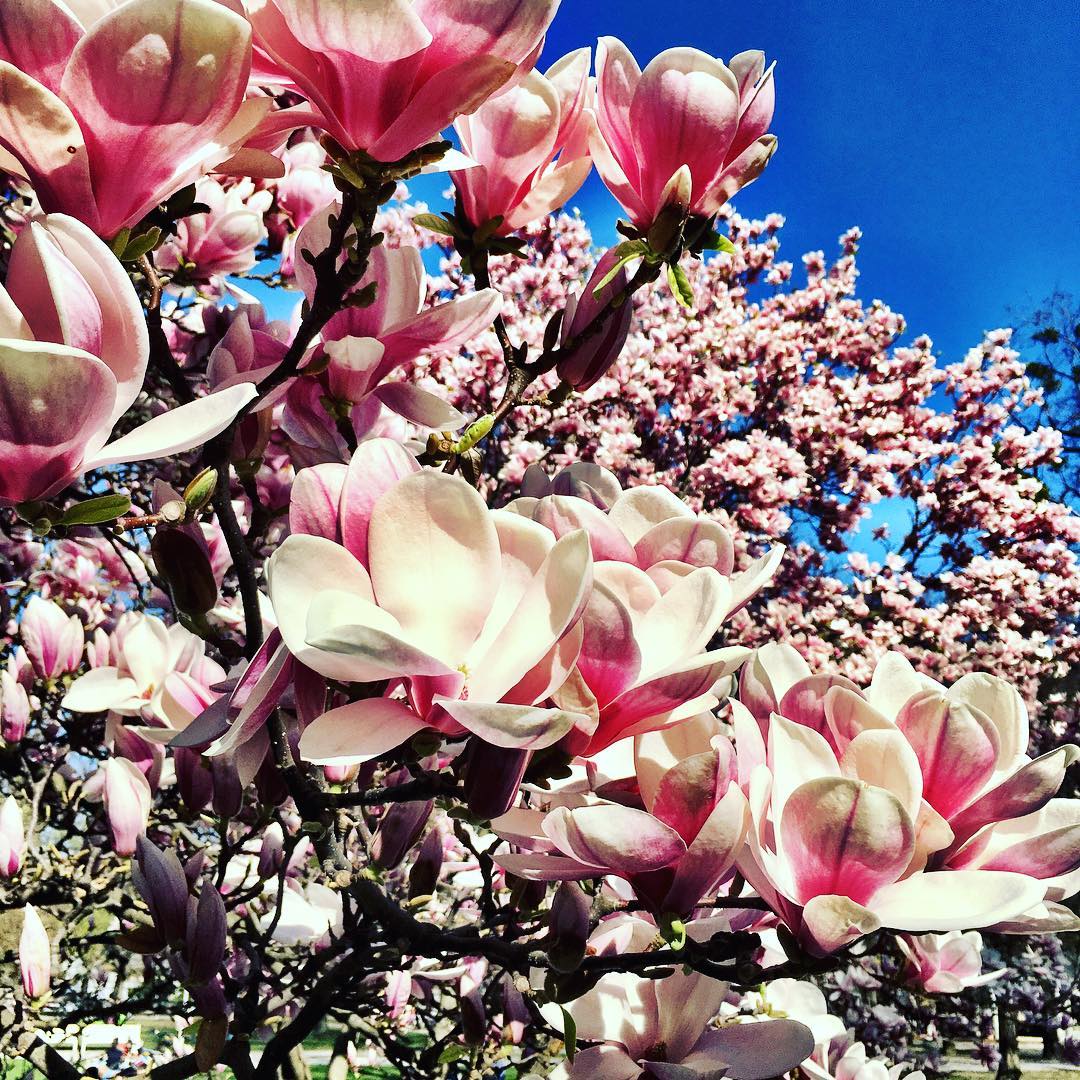
How does it work in practice? In a nutshell, the algorithm searches for associations between all the hashtags derived from posts. It then identifies topics and indicates the most representative hashtags for them (of which only 10 are shown in the last column). A share of 24.9% in the second column means that the “spring magnolia flowers” topic covers a quarter of all collected hashtags.
This method6 proved to be particularly useful in the data mining stage, helping us to uncover relationships between multiple hashtags. To see the details, take a look at the full data visualisation.
4. Image pattern recognition
The final means of categorisation was fundamentally different. While previously, we relied on users’ hashtags, here we examined the photographs themselves. Google Vision API algorithms automatically recognise the content of images and label them (including the level of probability7), which we then grouped and sorted by frequency of occurrence.
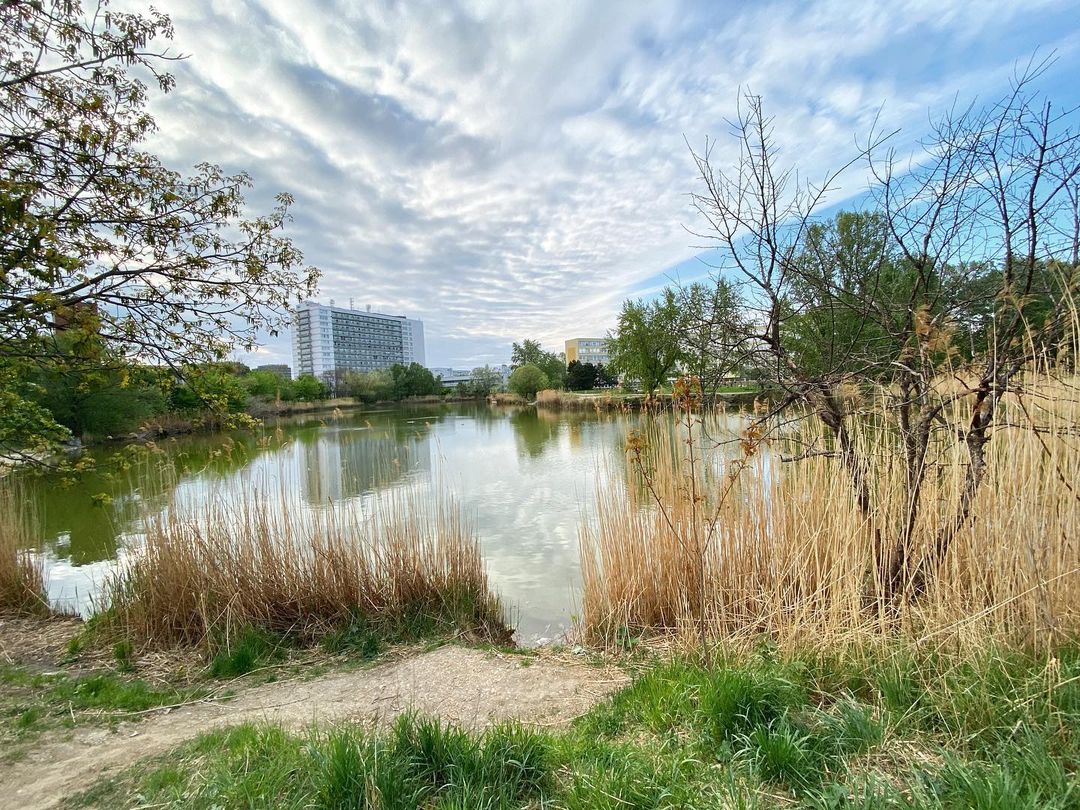
Jazero Rohlík, photo by sysina93
At this point, we were finally ready to begin the exploration. See examples of what we have discovered.
Park seasonality
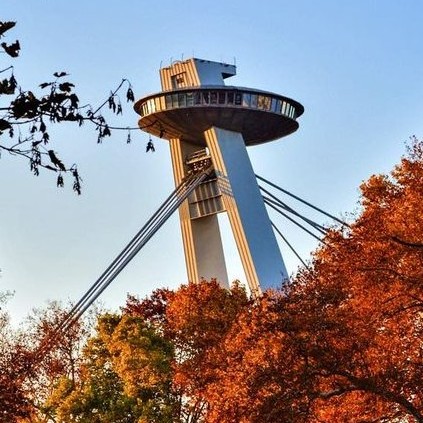
In autumn, each city park experiences a spike in visitors. Who wouldn’t want to earn a ton of likes for a trendy photo of colourful chestnut or maple leaves? This pattern is also confirmed by the most common hashtags, which show #fall or #autumn ranking particularly high. However, it was interesting to discover that one park is particularly popular in spring because of its blooming flowers. Yet another one also turned out to be frequented more than others during the winter season.8
While the analysis of just one place draws our attention to the highest, most typical values (hashtags or photo labels), the comparison of parks reveals significant features in a broader context and nuances their meaning.
Implicit links between activities
The post subject is another element that we can tap into when comparing categories. Tracing the popularity of a certain topic has benefits in itself as it allowed us to identify that one place is crowded with animal lovers while another sees flocks of Instagram influencers. Yet, digging deeper and looking at concurrent categories gave us a broader overview of visitors' activities. We could see, for example, while happiness is associated with family in one park, it is attributed to pets and outdoor activities in another.
Shifting user patterns
Another valuable approach was to study how trends changed over time, especially during the turbulent pandemic period. Exploratory data visualisation played a particular role here, helping us to discover the trends in the number of posts or the frequency of certain hashtags. This way, we establihed which parks were losing or gaining traction, as well as how the 2020 lockdowns shifted typical visiting patterns.
While the graph above shows a wider pattern, reinforced by the pandemic, a closer examination of data from just one park reveals what is likely to be a temporary change in user behaviour over the course of one year.
Although some of our insights were specific to selected parks or single events, many revealed broader trends in how public spaces are currently used. It will be interesting to see if the pandemic permanently changes how often and in what ways we enjoy city parks. For now, check out our in-depth reports dedicated to five popular parks in Bratislava.
Takeaway
Why is Instagram a valuable data source in the first place?
- Social media is a popular outlet for city residents to express how they feel about the city in the form of pictures, videos and captions.
- Contrary to popular belief, a large and diverse proportion of the public actively use Instagram nowadays; it is definitely not “just the young people”.
- Users unconsciously provide data about their usage patterns and sentiments, which, given a proper interpretation, makes the data more relevant compared to directly asking people about their thoughts or feelings.
- Although it is easy to question the quality of Instagram data, the posts are relatively easy to obtain, which makes the platform a good source to supplement other studies.
In which areas of city research is Instagram data most useful?
- Monitoring the popularity of places in time.
- Observing the changes in the perceived and actual character of a place in time (e.g. by hashtags).
- Tracing the movement of people within the observed space by checking the location from where they posted.
- Identifying how specific events like festivals, public space revitalisation projects or any other irregularities generate change in the surrounding area and influence the visitors’ sentiments.
- Determining to what extent spaces are represented on Instagram and identifying their online profile. This enables a comparison between the physical space and its portrayal on Instagram.
What will make the Instagram-based study more accurate?
- Comparing multiple things rather than focusing on one element could partially offset the problem of unrepresentative data samples from social media.
- Having a time perspective helps capture occasional spikes in popularity caused by one-off events that could distort the results of wider trend analysis.
- Selecting a relatively narrow topic can limit the need to deal with irrelevant content and ordinary spam, but being too specific may result in the shortage of posts and insignificant data samples. For example, a study of Bratislava tourism would certainly be interesting, as well as time-consuming. However, it might be challenging to use Instagram data to study just one small street or a single city attraction.
-
API (application programming interface) is a tool that allows other computers to access Instagram posts and download them automatically in large numbers. ↩︎
-
Based on the following selection of hashtags: #aesthetic, #autumnvibes, #coffee, #enjoythelittlethings, #fashiongram, #fashioninspo, #foodporn, #happiness, #instagood, #ootd, #photography, #photooftheday, #photoshoot, #picoftheday, #portraitphotography, #smile, #sonyimages, #vsco, #vscocam. ↩︎
-
The source code will be available in July 2021. ↩︎
-
Unlike a few years back, Instagram no longer provides the detailed location of a post (nor is it possible to identify it based on the image’s EXIF data) – a major limitation for city researchers. ↩︎
-
We accessed the posts (excluding stories and videos) via two Instagram API endpoints – using specific hashtags (e.g. #sadjankakrala) and the parks’ location. ↩︎
-
By testing multiple diverse samples, we defined a confidence level at above 0.81. ↩︎
-
The data presented in this article is valid as of April 1, 2021. ↩︎
