Data cleaning
So, you have your data set and you’re rushing to analyse it? Not so fast. Before data scientists conduct any study, they usually spend 80% of their time cleaning and transforming data – otherwise, they may be useless, resulting in misleading visualisations.
1. Inspecting the CSV file
Let’s first look at the way our data is stored. This is a good time to get to know the CSV file, which is one of the basic data formats.
You may wonder why to keep data in a plain text file when we can use more sophisticated options such as spreadsheets or databases? The problem is that they store data in a way that is not always understood by other programs. For this reason, small data sets are often kept in ordinary text files, such as CSV, so they can be read quickly by any computer without installing additional applications.
In a nutshell, a CSV is no different than a typical data table inside a text file with values separated (most often) by commas – as opposed to the column boundaries in the excel table.
col_1,col_2,col_3
val,val,val
val,val,val
| col_1 | col_2 | col_3 |
|---|---|---|
| val | val | val |
| val | val | val |
A quick file inspection before you start working with the data is a good habit for any analyst. It will help you get a sense of what’s inside the data, discover missing records or spot other errors that may have occurred while writing data to the file. If you don’t have more advanced software at hand, you can quickly preview the CSV file content by using online tools.
- Upload the CSV file to WTFcsv online tool to see what’s going on inside
- The nineteen online app will help you perform a visual exploration of data
- You might also want to validate your CSV file to make sure it has a proper structure and it’s fully readable
- Later in this course, we will learn how to switch between different data formats. A quick Google search allows you to find a lot of useful utilities for working with text files
2. Data cleaning and transformation with OpenRefine
In this exercise, you will explore Open Refine, a tool used by researchers and data journalists, first created by Google, currently developed as an open-source project. It will help you automatically clean your data, correct language inaccuracies, and perform table transformation from wide to long format.
◕ Import data and create new project
You can import data to OpenRefine directly from any online source (url) like Google Sheets or upload files in different formats (e.g. csv, JSON, xlsx).
- Select [ Browse… ] and upload the CSV file – let’s grab the file with raw survey results to make it more interesting.
- Click on [ Next ] » Enter the project name and check out available options » [ Create Project ]
◕ Handle missing data
- Select [ ▾ address_city ] » Facet » Customized facets » Facet by blank (null or empty string)
- Click on [ include ] next to the
truevalues
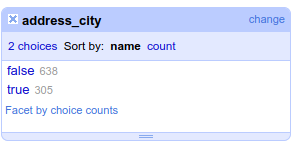
- Select [ ▾ All ] » Edit rows » Remove all matching rows
◕ Make common data cleaning tasks
A common job of a data analyst is to remove trailing spaces or split values from one to multiple columns. Many of those predefined actions can be performed in OpenRefine much faster than by typing formulas into a spreadsheet.
- Select [ ▾ address_street ] » Edit cells » Common transforms » Trim leading and trailing whitespace
- Select [ ▾ address_street ] » Edit cells » Common transforms » To titlecase
- Select [ ▾ date ] » Edit column » Split into several columns (using separator)
- Repeat the same pattern using field length
- Select [ ▾ education_university ] » Edit cells » Transform… »
value.replace("UŚ", "Uniwersytet Śląski").trim() - Edit manually a few records, e.g.
asp, Politechnika
Explore some other options as well.
◕ Clean up and standardise text data
If you work a lot with survey data, you may have a hard time cleaning up the records – e.g. street names or education background – entered manually by survey participants. Losing hours to make the names written in dozens of ways consistent? (e.g. Środmieście, Środmieście, Śródmeiście, Srodmiescie, środmieście). This is where OpenRefine shines – using algorithms that analyse natural language to help you tackle this otherwise tedious task.
- Select [ ▾ address_city ] column » Facet » Text facet
- Edit manually a few values
- Click on [ Cluster ] and test out available algorithms – check out: Method [ ▾ Key collision ] and Keying Function [ ▾ fingerprint]
- Repeat the same task to
address_districtcolumn - Save your work to a file by selecting [ ▾ File ] » Download » Comma-separated values
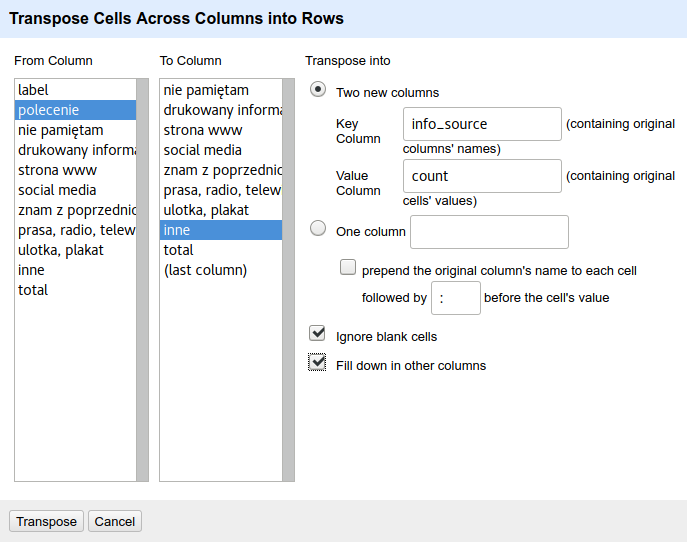
◕ Transform table from wide to long
If you’ve ever dealt with a spreadsheet, you’re probably used to storing data in a wide table with multiple columns. However, many other tools, e.g. for data visualisation, require the data in a long form (also called tidy or stacked) with only one value in a single row (where each variable is a column). While completing this transformation using spreadsheets is not a trivial task, with OpenRefine it will only take a couple of minutes.
- Import new dataset csv
- Select [ ▾ label ] » Transpose » Transpose cells across columns into rows…
- Choose columns to transpose and set new column names. Make sure to tick ✓ for “Fill down in other columns”
PRO TIP: Read more about tidy data or see this video.
UNTIDY DATA
| student | maths | physics | pe |
|---|---|---|---|
| Anna | 4 | 5 | 5 |
| Robert | 2 | 4 | 3 |
| Stefan | 5 | 5 | 3 |
TIDY DATA
| student | subject | mark |
|---|---|---|
| Anna | maths | 4 |
| Anna | physics | 5 |
| Anna | pe | 5 |
| Robert | maths | 2 |
| Robert | physics | 4 |
| Robert | pe | 3 |
| Stefan | maths | 5 |
| Stefan | physics | 5 |
| Stefan | pe | 3 |
◕ Transpose/pivot table from long to wide
We have just learned how to tidy up (stack) our data, and what if we would like to make an opposite transposition – from long to wide table? Very often this will be necessary when counting values in the consecutive rows. While this can also be done in OpenRefine, let’s move for a moment to Google Sheets to discover a very popular and extremely useful feature of creating pivot tables.
Let’s assume that we are interested in the number of participants from different cities and then districts of Katowice.
- Inside a spreadsheet select [ ▾ File ] » Import – to upload the CSV file
- Select [ ▾ Data ] » Pivot table
- Select the values to be analysed (in this case the whole table)
- In rows [ Add ]
address_city&address_district - In values –
idandCOUNTA
◕ Apply the same cleaning patterns to another file
Suppose you performed several operations on data, then your data set has been updated with new values. Fortunately, you don’t have to do all the work from scratch. You can save a list of executed steps and apply them to another similar file.
- Select [ Undo / Redo ] and than [ Extract… ]
- Copy the contents of the right-hand window manually (use
Ctrl + a) - Save it to a text file using your favourite editor
- Create a fresh project in OpenRefine
- Select [ Undo / Redo ] and than [ Apply… ]
- Paste the formula from your text file and click on [ Perform Operations ]
◕ Try parsing data from larger files
If you work with larger files comprising hundreds of thousands lines, your spreadsheet may not be ready for such challenges. However, OpenRefine should be able to handle them, and unlike a spreadsheet, they can come from XML or JSON as well (please note that you may need to allocate more RAM memory to OpenRefine). This makes OpenRefine a powerful companion to popular commercial data processing applications.
- Search online for a large CSV file of more than 1 mln rows or use the Urban Dictionary corpus (2.6 mln rows) available at Kaggle (you need to sign up first).
- Allocate more RAM to OpenRefine (e.g. 3072M)
- Load the file using OpenRefine. Start with 1 200 000 rows to make sure your machine can handle it (to do this, tick
Load at most 1200000 rows of data) - See which functions are possible to perform. You will most likely be able to work with numbers or split text cells but more complicated operations – e.g. text facets or clustering – can be difficult to perform
See OpenRefine documentation.